
Recently, after I switched to FreeBSD on my server, I decided to pay more attention to the temperatures. As I’m using Prometheus with node_exporterthe CPU temperatures are exported as node_cpu_temperature_celsiusautomatically. They didn’t, however, show any values (only NULL). It turned out that the special device driver has to be loaded first: coretemp. In order to enable it, it has be added to /boot/loader.conf:
echo 'coretemp_load="YES"' >> /boot/loader.conf
After reboot, sysctl will reveal some new values, these among others:
sysctl -a | grep "dev.cpu.*.temperature"
dev.cpu.3.temperature: 56.0C
dev.cpu.2.temperature: 55.0C
dev.cpu.1.temperature: 55.0C
dev.cpu.0.temperature: 55.0C
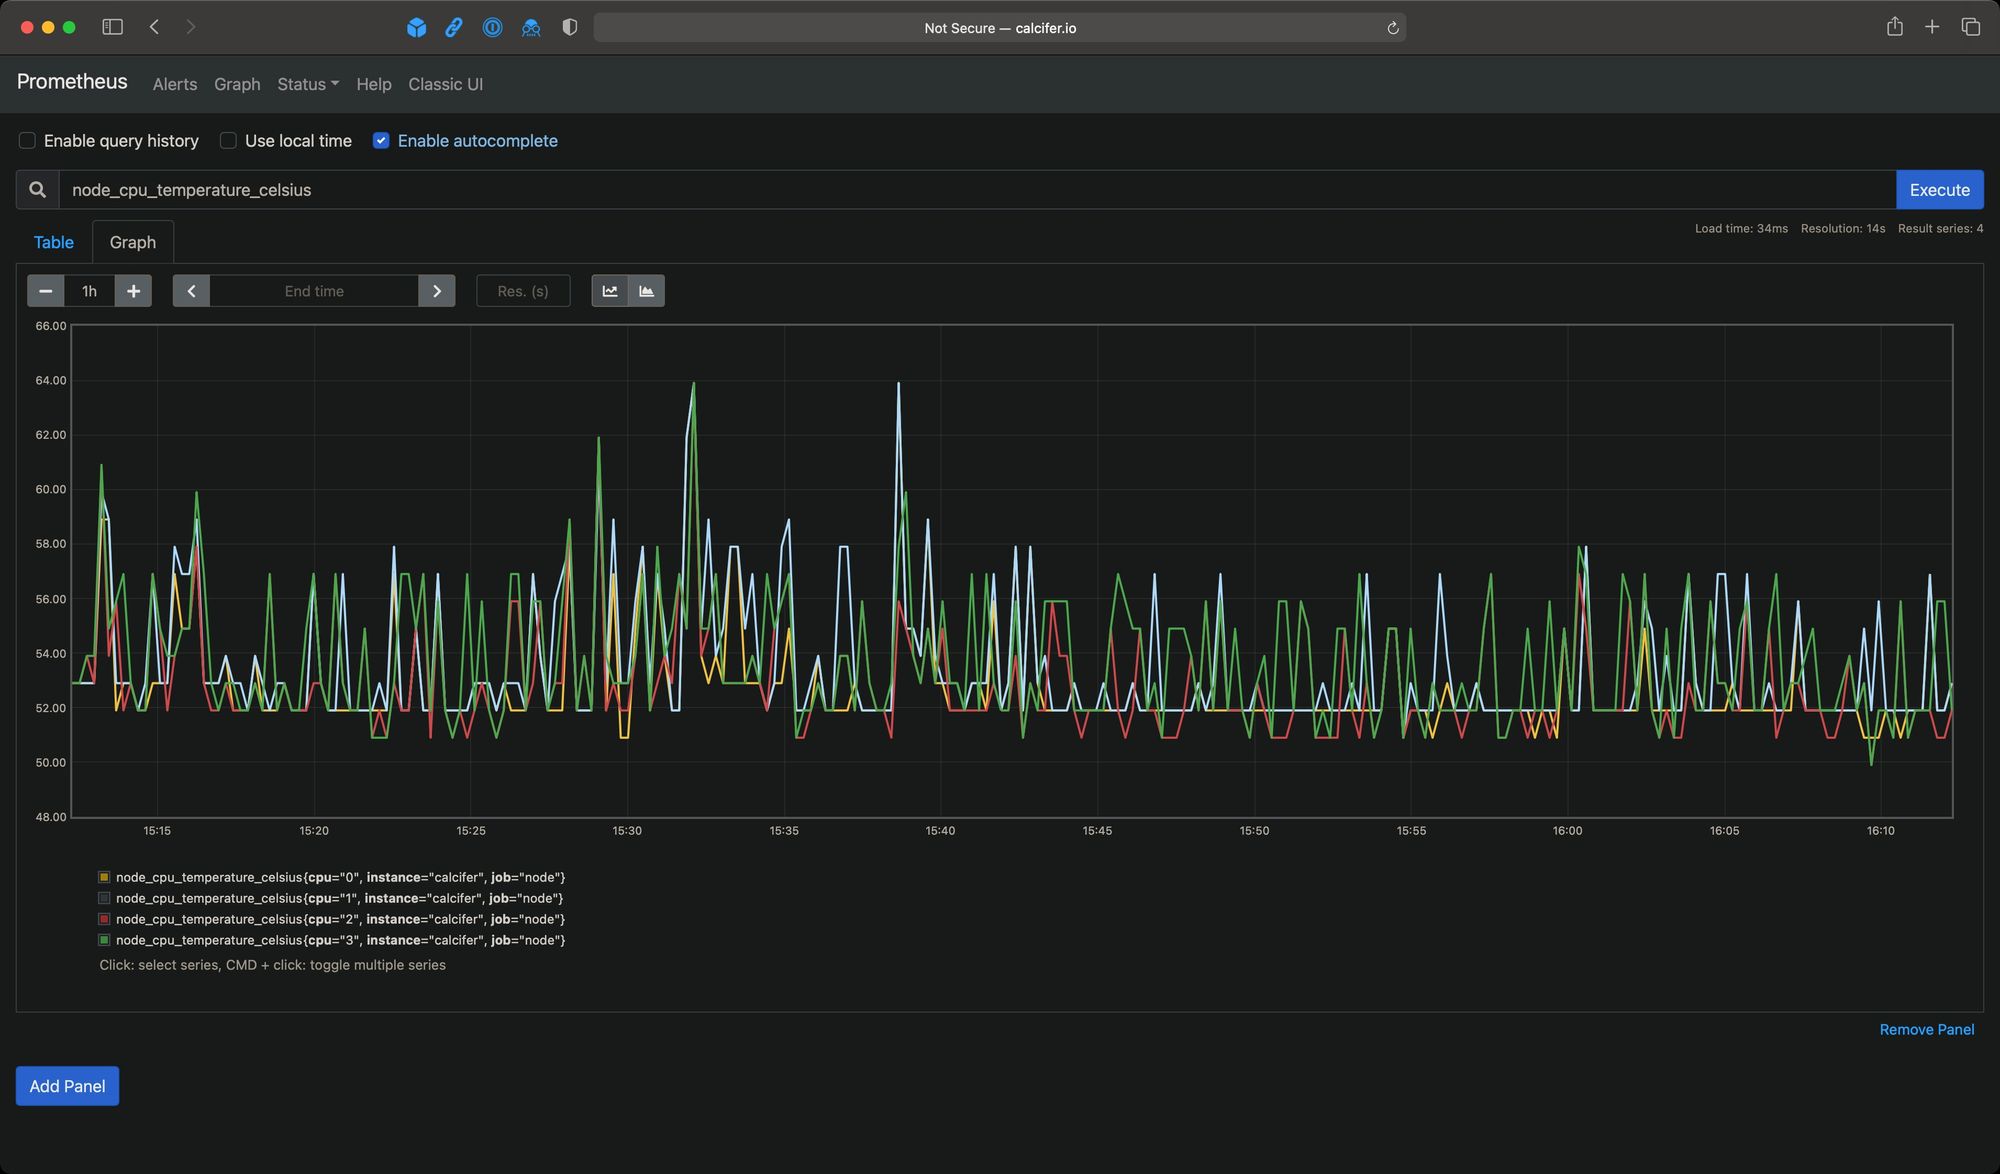
node_exporter is going to scrape them by default:
OK, but I also wanted to monitor temperature of my spinning drives in the enclosure connected to the NUC. Both drives are SMART-enabled and provide all of the necessary data – it’s a matter of scrapping it. Ideally I didn’t want to introduce any additional exporter so I looked into textfile-collector-scripts repository and sure enough found smartmon.sh. After slight adjustments and bending to make it work on FreeBSD (I put the result in this gist), I had shell script with the output in the format I needed. As is suggested by the text-collector authors I decided to use sponge from moreutils to output file in the scrapped directory – on FreeBSD it defaults to /var/tmp/node_exporter. Here’s the resulting cronjob entry:
# S.M.A.R.T. collector
*/1 *   *   *   *   root /usr/local/bin/smartmon.sh | /usr/local/bin/sponge /var/tmp/node_exporter/smartmon.prom
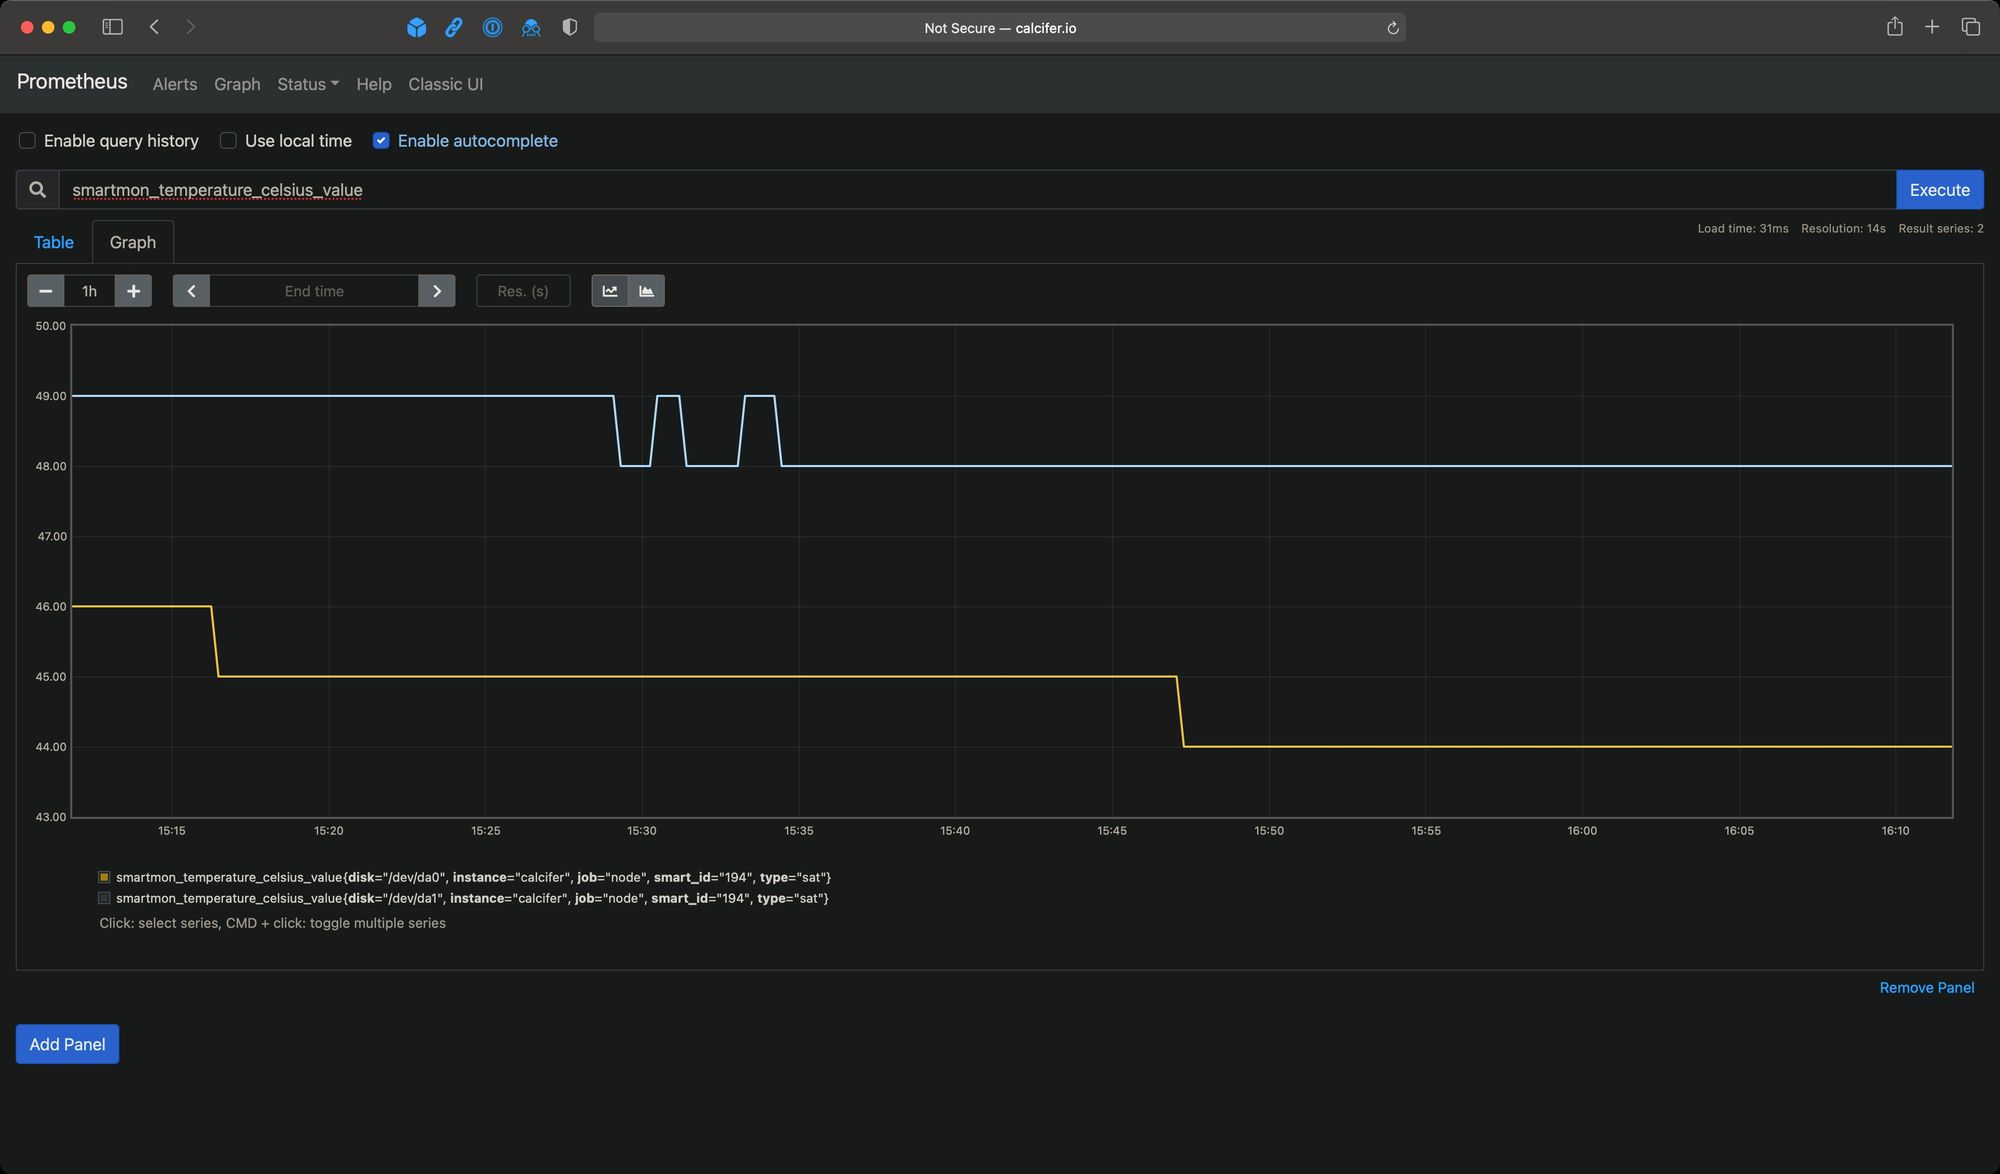
After that’s done and first results will land in the given directory, the new entries will appear in Prometheus. The one I was interested in the most issmartmon_temperature_celsius_value:
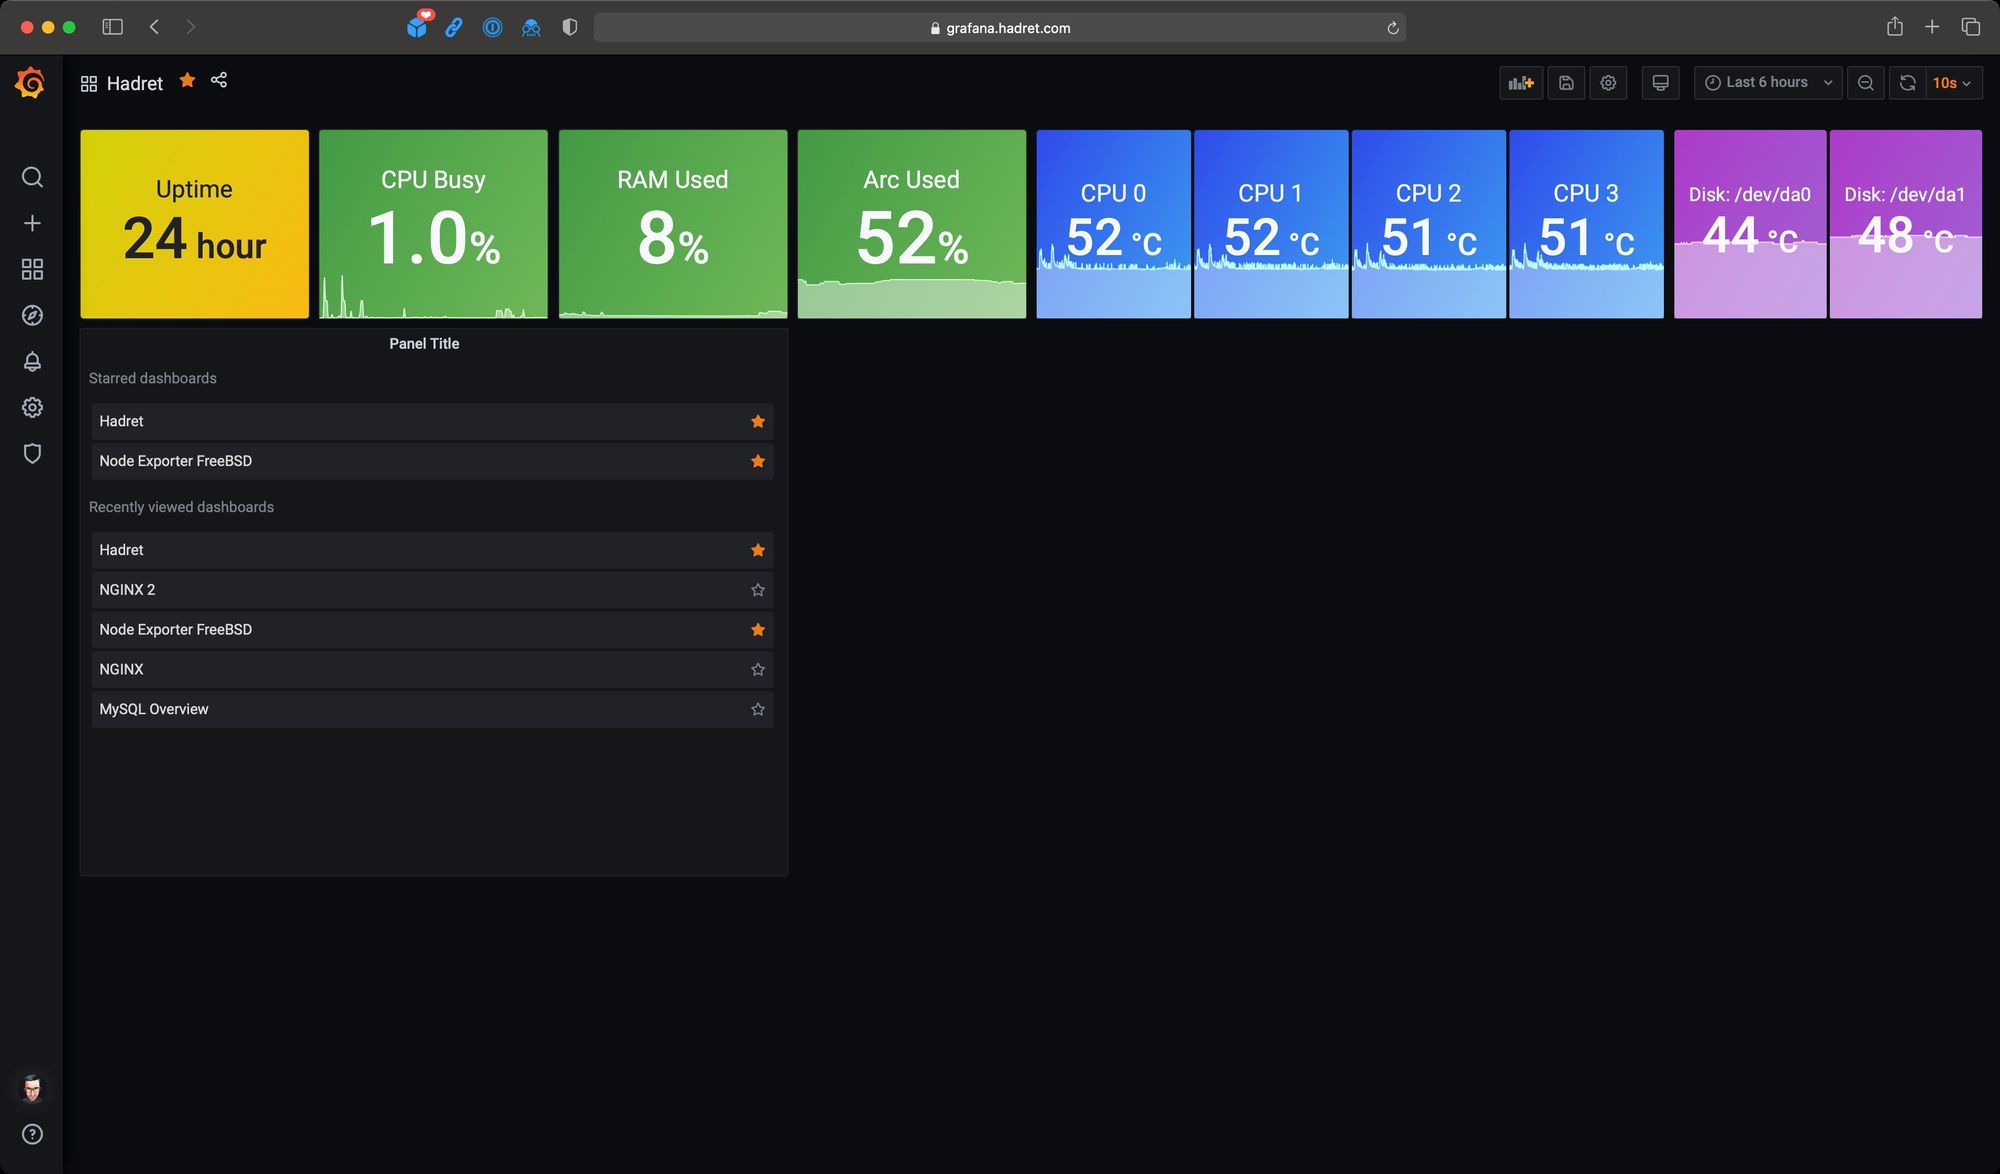
Once these are in it was just a matter of creating a quick dashboard in Grafana.

Discussion